Behind that lies a story. As Olof noted, GISS this month switched from using ERSST V3b to ERSST v4 (I switched last month). They show some plots of the differences here. Here is the difference plot

In the new file April 2015 is the same as before, and May only increased by 0.02°C. But the plot shows an annual difference of more than 0.05°C in recent years. I plotted the monthly differences (GISS v4 - 3b) over the last five years:
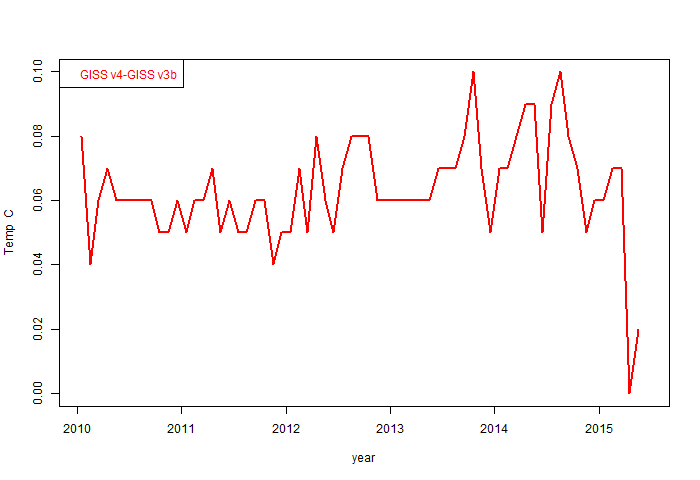
April and May do look quite different. I wonder if GISS is still using v3b there? Anyway, the usual maps and commentary are below the fold:
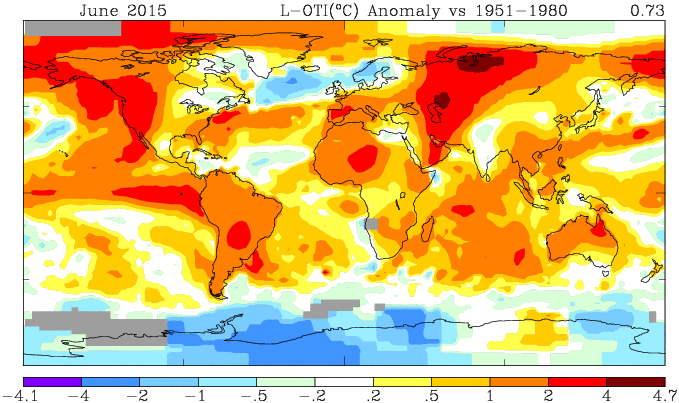
Here is the GISS map for June 2015:
And here is the corresponding TempLS mesh map, based on spherical harmonics:
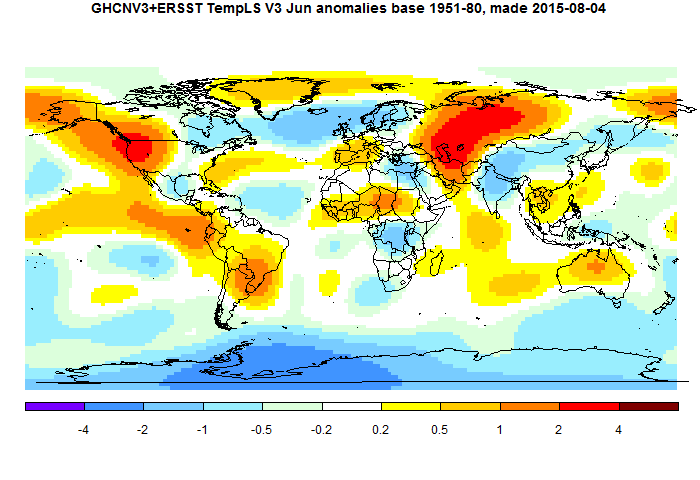
TempLS is somewhat smoothed so doesn't show the peaks of GISS. But the features are just the same. Heat in central and W Russia, and in NW N America. Cool in Antarctica, and N Atlantic, extending over Scandinavia.
You may have noticed that an error had got into my TempLS map plots recently. They were shown with mean subtracted, and so much colder. This has been fixed.


Another change is that they don't use GHCN data from Amundsen-Scott base anymore, but only SCAR data from this site. SCAR data looks more like unadjusted GHCN. SInce GHCN adjustments has cooled the South pole by 1 degree C since 2008, this change may warm millions of km2 with the Giss 1200 km extrapolation.
ReplyDeleteData for Byrd station,West Antarctica, are still not used for May (and June), although they are available by CLIMAT messages. In May temparatures at Byrd may be as much as 5 C warmer than the Giss infill. This station also represents millions of km2 with its central position in West Antarctica. Byrd station seems to be cool in June though..
Interesting. I looked up Amundsen-Scotthere. Yes, adjusted down since 2008. But what I found odd is that there is a lot of missing months since 2010. For such a large technical station, this is surprising. Using SCAR data instead does make sense, and would have an effect.
DeleteIn GHCN-M, BYRD has no recent data.
The change from ERSST V3b to ERSST v4 has a substantial effect on the previous years.
ReplyDeleteYes, the last months look like they use still the older version there. Also in the maps they seem to use the older version in all months.
http://data.giss.nasa.gov/gistemp/maps/
There is also the Hadl/Reyn_v2. Is this close to the older ERSST version?
BEST uses also HadSST. Is this the same version? What are the differences between the three different SST data sets? Which should be used? It is confusing.
At least in the HadSST used by BEST there are strange variations in the early 20th century still present. Probably due to not fully corrected changes in the SST measurements. A strange downward slope from 1890 to 1910, a large upward jump from 1936 to 1937 which can clearly seen after ENSO correction, and probably also a downward jump or slope after 1945. Has the ERSST V3b/v4 also this problems?
I checked with Cowtans trend calculator, the trend of Gistemp is now significant (2 sigma) from the year 2000, and all start years before that.
ReplyDeleteERSST v4 increase the WW2 spike as well, the years 1944 and 45 as much as 0.12 C.
IMO the bucket correction and transition from buckets to ship sensors, are the largest sources of uncertainty and potential bias in the long term global temperature series.
The WW2 was likely a mess with less observations and change of routines...
You got a shootout from GISS:
ReplyDelete2015-07-19: Closer inspection showed that there was a bug in the ERSST v4 part of the automated update of the ocean data files. The temperature analysis was repeated based on a separate manual construction of the basic ERSST v4 file (SBBX.ERSSTv4). We'd like to acknowledge and thank Nick Stokes for noticing that there might be a problem with the data made public on 2015-07-15. All data and displays were corrected and replaced on the public site today.
http://data.giss.nasa.gov/gistemp/
Wow, thanks. I've updated the numbers here. Apr-Jun goes up quite a lot, with a 0.04°C rise from May to June, It will make a difference to Sou's plot.
DeleteI see that it was actually Sou who contacted them. So she really deserves the credit.
DeleteNick, I did contact them after you commented at HW the other day, but I now have it on *very* good authority that isn't what prompted the change. The people at GISS were alerted by your article here :D
DeleteAh, yes, everyone comes to Sou's :)
DeleteUmm, based on another *very* good authority, I now take back my previous comment :)
DeleteAh, well, climate science is famous for its adjustments :)
Delete